Storm Track: Innovative Tracking of T-storm convective cells
The thunderstorm is a type of storm produced by a cumulonimbus cloud. It could be characterized by the presence of lightning, heavy rain or snow , hail, strong winds. The basic ingredients used to make a thunderstorm are moisture, unstable air and lift. You need moisture to form clouds and rain. You need unstable air that is relatively warm and can rise rapidly. Finally, you need lift. This can form from fronts, sea breezes or mountains. Many severe phenomena related to them (flash floods, downburst winds) and are very dangerous for air navigation etc..
Knowledge of severe local storms has been increasing rapidly in recent years as a result both of observational studies and numerical modelling experiments. One of the new popular words in meteorologhy has become: nowcasting. Nowcasting comprises the detailed description of the current weather along with forecasts obtained by extrapolation for a period up to 6 hours ahead. In this time range it is possible to forecast small features , such as individual storms with reasonable accuracy. In this contest one of the most used nowcast instruments is the satellite.
Weather satellites are used to get a space-bird's eye view of Earth's atmosphere. Visible and infrrared images are used to detect the amount of water vapour at various altitude or and ground and sea temperatures while winds can be calculated by measuring cloud motion and precipitation amount estimated. Using a combination of the visible and infrared channels, convective clouds and t-storm tracking motions can be detected as a new frontier of the sat monitoring.
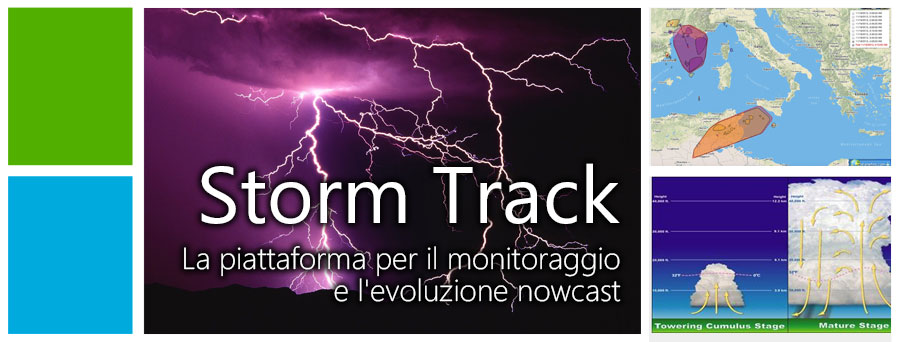
The pic above represent the three stages of developments of a cumulo nimbus cloud.
Extrapolating data from the satellite we can have a continue and very detailed stream flow info of the size, shape, intensity, speed and direction of movement of individual storms . Thanks to the high resolution of the satellite sensors all the area of operations can be monitored at a resolution of 3 Km updated every 15 minutes. In other words this means having a data on an high resolution basis for virtual point of measurments every 3 kms on a regular grid.
The algorithm works with the sat channels described below:
Use the visible 5,6 and 9 channels
-7.3-10.8>0: cloud base detection (early detection)
-6.2-10.8>0: cloud top detection (Kolios and Feidas)
-Connected components
-Convex approximation
-Object definition (properties)
-Short term cells motions forecast up to 45 minutes
-Easy interface with existing
lightnings and radar networks
The platform allows the detection, monitoring and forecasting of the convection inside a cell , defining the shape, the size and the evolution of the clouds with an intuitive color scheme (yellow triggering, orange growing, blue mature, purple dissipating)with an intuitive short term forecast up to 45 minutes, You can see the forecast trend as a dashed line in the image below.
This tool was born to be a satellite data based software but there is also the possibility to associate a grib file with model fields to increase the information (i.e. the height, the pressure of the top or the of the base, the relative humidity, vertical velocity) about the convective cells both in nowcasting and short term forecasting. The wide coverage assured by the Meteosat and the high rate ( 15 minutes ) of sat the images update allows a complete convective clouds step by step evolution monitoring.
In the image above the Storm Track updates every 5 minutes you can see the numerical data available T clouds top, Area, Severity, Evolution , Accuracy, Efficiency indexes
Other important updates are:
-New area coverage Tks to MSG 1 IODC India and Asia
-Storm Track can be interfaced with all the geostationary satellites (Himawari 8 etc.).
-Full interface with third part weather model , weather radars and ligthning networks to better calibrate the output and tracking convective cell motion
All the outputs are avalilable via secure access API webservices
� Datameteo tutti i diritti riservati - Modellistica ed Elaborazione Dati di LRC Servizi Srl P.I 03358090045. Base inizializzazione dati NOAA .
Ottimizzato per Firefox-Safari-Chrome-IE8 LRC Servizi Srl - C.C.I.A.A. Cuneo R.E.A. n. 284623 - Reg. Imprese C.F. Partita IVA: 03358090045